Before starting, would you like to play with below map?
It is the Racial Integrity Ranking Map of states where n1 = most integrated
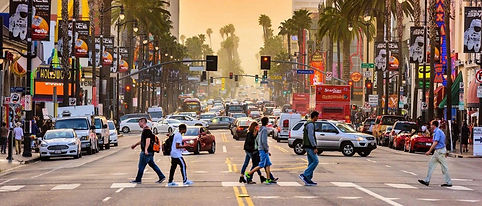
Los Angeles, CA
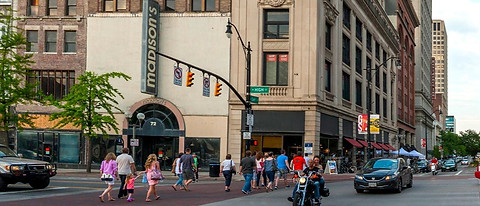
Columbus, OH
We have the daily data of police stops in both city centers between 2013 & 2015.
Both of them looks quite diversified, right?
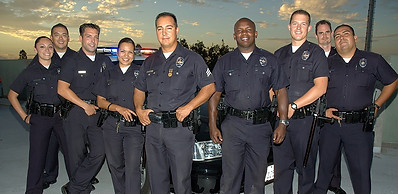
Would you like to know how fair the traffic police is?
Los Angeles
City Population %
Police Population %
Count of Stops %
per Race
Columbus
City Population %
Police Population %
Count of Stops %
per Race
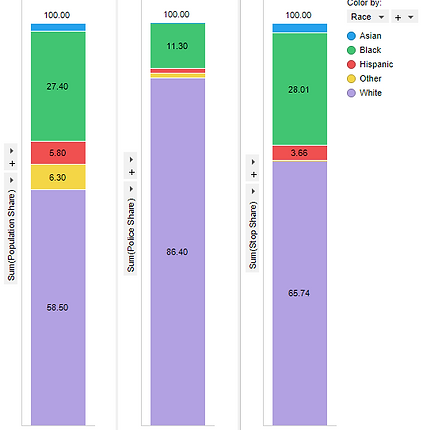
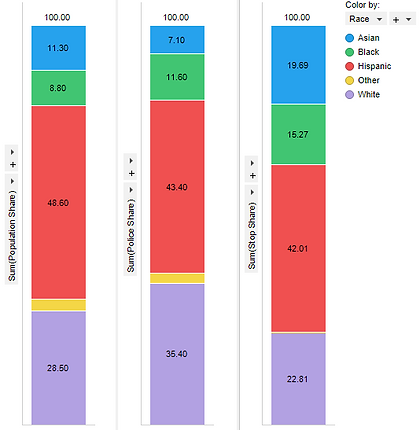
This is the LA city:
This is the Columbus city:
This is the LA police:
This is the Columbus police:

At the first glance, stop counts seem somehow balanced, eh?
Maybe, stop count of blacks might be a little bit higher than expected in LA?
Wait, it is too early to judge! We need to interpret not only the counts, but the behavior of the drivers & the police!
The methodology is to calculate two main features:
1- Driver Impact Score (DIS)
2- Police Response Score (PRS)
Check out below example video to understand these scores:
Correlation matrices is the the best and easiest way of having an insight about the relation between independent features. Are you ready to see the correlation between race and DIS & PRS?
If you look carefully, we ping the cells you need to focus on.
Los Angeles
Race vs Scores
Correlation Matrix
Columbus
Race vs Scores
Correlation Matrix


Oops! We have four findings here. Now, we need to ask below questions:
1. Might LA police over-respond to Hispanic drivers, even though Hispanic drivers might commit lower crimes than others?
2. Might Middle Eastern drivers in LA higher crimes than others?
3. Might Columbus police over-respond to the black drivers?
4. Might Hispanic drivers in Columbus higher crimes than others?
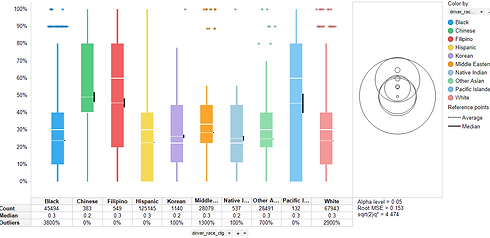
To answer these, let's deep dive into distribution of the data. Box-plots below might seem too complex at the first sight. Don't worry, we picked what you need to catch. See?
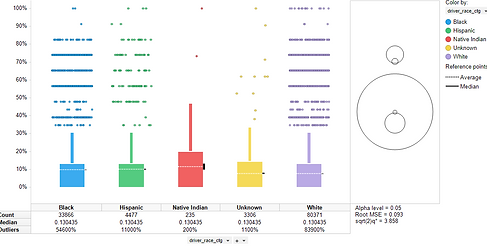
Los Angeles
Driver Impact Score Box-plot
per Race
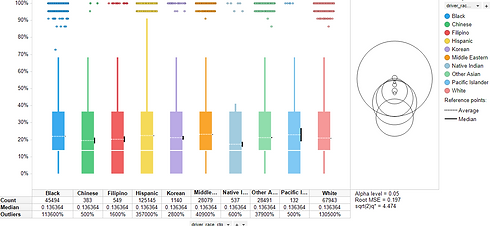
Columbus
Driver Impact Score Box-plot
per Race
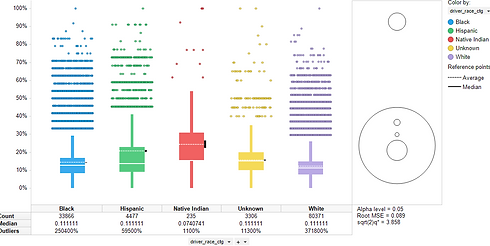
Los Angeles
Police Response Score Box-plot
per Race
Columbus
Police Response Score Box-plot
per Race
When we check DIS and PRS distributions on race, we have that there is a significant divergence of black drivers in Columbus for both scorings, particularly in Police Responce score.
Well, here is the histogram of DIS & PRS in Columbus
per black and all others:
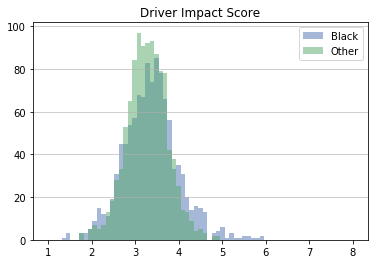
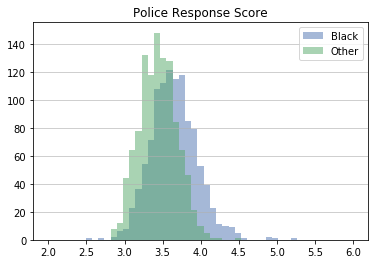
What do you think?
Let us tell you what we think. There is a portion of black people who commit higher crimes than others in traffic. However, the Ohio traffic police tends to over-respond to the all black drivers.
It is statistically proved that the average DIS of black people is not significantly higher than the others; while the average PRS towards them is.
DIS (Driver Impact Score): 15
DUI (Driving Under Influence): 10
Non-moving: 5
PRS (Police Response Score): 21
Incidental to Arrest: 8
Frisk: 5
Inventory Search: 8